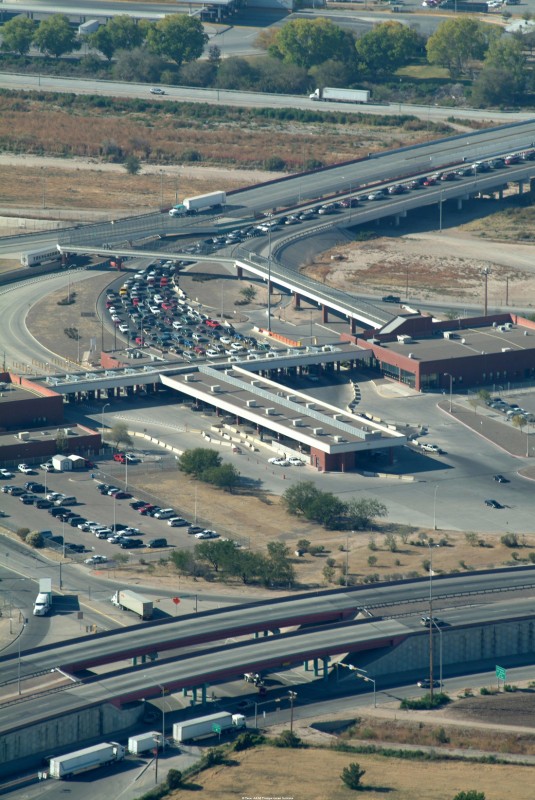
For shippers, time is money, so being able to monitor and quantify even small variations in delay at the border can have a measurable impact on a company’s bottom line.
What’s the problem?
Required security inspections and increased truck traffic at U.S.-Mexico border crossings create delays that are disruptive and costly to manufacturers, shippers and, ultimately, consumers. The impacts of these delays are not confined to the immediate area of a specific border crossing (in the case of this research, the El Paso – Ciudad Juarez region). Instead, these delays have broader implications and far-reaching consequences across the United States because border crossing delays in El Paso can affect product prices and quality in the hundreds of cities awaiting delivery of those products.
What’s the solution?
Shippers need the most current information available on traffic conditions, border wait times and the economic costs of those delays to determine the best departure times and select the right port of entry. Because conditions can change several times a day, it is important that the information provided to stakeholders be as close to real time as possible. With sufficient accurate information, shippers can build in buffer time for some shipments or take other steps to adjust for the delays.
How was the study done?
Researchers at the Center for International Intelligent Transportation Research developed a dashboard to present delay information and related cost information for U.S.-bound trucks. This is the first such development specifically for use at international border crossings. The dashboard displays information in four categories:
- delay-related key performance measures;
- commercial vehicle volumes;
- economic information, such as freight values and volume trends and exchange rates; and
- delay-related direct costs to shippers, such as fuel costs and driver wages.
In addition to current information, the dashboard also illustrates delay trends and their economic cost over time. This trend information can be used by decision makers to determine the most effective strategies or policies to maximize efficiency and business success. The same information can also be beneficial to policy makers in departments of transportation, metropolitan planning organizations, etc., who can make more informed policies and decisions regarding future operations at border crossings.

The dashboard development built upon earlier research by CIITR that examined crossing times at the Bridge of the Americas (BOTA) because that bridge offered a unique opportunity to draw upon near-real-time data and Radio Frequency Identification archived data on bridge crossing times. Another RFID system was subsequently installed at the Pharr-Reynosa port of entry.
Research Benefits
Information on crossing times and economic impacts is critical to a broad range of stakeholders, especially those involved in just-in-time trade (such as the maquila firms located near the border) and those transporting perishable cargo, because it allows for immediate trip-planning decisions. For shippers, time is money, so being able to monitor and quantify even small variations in delay at the border can have a measurable impact on a company’s bottom line. The dashboard developed by CIITR researchers makes that possible.
Project Title
Border Delays and Economic Impact to the Freight Sector: An Exploration of the El Paso Ports of EntryProject Number
186041-00005
Project Sponsor(s)
Center for International Intelligent Transportation Research
Project Categories
Economics & Policy, Freight Movement
Project Publications
For More Information
Sharada R. Vadali, Ph.D.
Associate Research ScientistMobility – Valley Park, Room 114
Texas A&M Transportation Institute
The Texas A&M University System
3135 TAMU
College Station, TX 77843-3135
Ph. (979) 845-3325
s-vadali@tti.tamu.edu
