A better understanding of how freight movement affects local and national economies can help stakeholders make more informed decisions impacted by and involving border trade.
What’s the Problem?
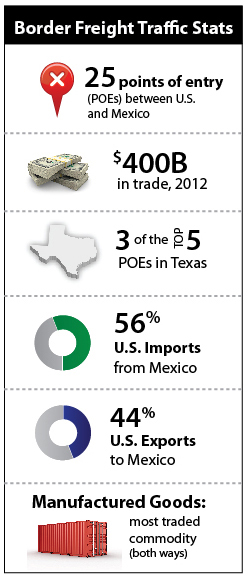
There are 25 land ports of entry (POE) along the 1,969-mile U.S.-Mexico border. These POEs serve as trade gateways between the two countries. Recent negative changes in the global economy resulted in a significant decline in trade and freight movement worldwide. This downturn prompted the United States to examine its border trade more closely. What goods are moving where? What ports of entry are most popular? What transportation modes are favored?
How Was the Study Done?
Since 2009, TTI’s Center for International Intelligent Transportation Research (CIITR) has studied freight activities of U.S.-Mexico POEs in Texas, California, Arizona, and New Mexico. Using data from the Trans-Border Surface Freight Database of the U.S. Bureau of Transportation, CIITR researchers have identified trends and quantified variations in freight movement across the border. Researchers classified freight by mode of transport (e.g., trucks and rail cars, empty and loaded), commodities (six commodity groups) and freight destinations.
Benefits of This Research
Better understanding what is being shipped where, the method for moving it, and how freight movement affects local and national economies, the environment, and congestion at traditional bottlenecks (i.e., border crossings) can help stakeholders make more informed decisions impacted by and involving border trade. These beneficiaries include but aren’t limited to:
- Shippers, who can reschedule or reroute freight to avoid congestion, which is particularly important for just-in-time freight movement (e.g., produce).
- Policy makers, who can make more data-based decisions regarding, for example, allotting the state department of transportation’s limited resources to facilitate trade (e.g., prioritizing the repair of roads used by long-haul trucks).
- Commuters and other members of the driving public, who can plan leisure and business travel across the border to avoid peak bottleneck times associated with freight movement.
- Environmental regulatory agencies, which can better manage border-town air pollution caused by long waits at border crossings through knowing when and where these impacts occur.
In particular, knowing which interior U.S. states trade most with Mexico can help inform policy makers and other stakeholders in these states to better prioritize border-related transportation infrastructure needs, thereby maximizing the economic benefits of efficient trade for those states and the nation as a whole.

Study Findings
From 1995 to 2012, surface trade between the United States and Mexico has risen from approximately 100 billion to 400 billion (in U.S. dollars). Essentially, trade has quadrupled despite the recession of the early 2000s and the global financial crisis of 2007. Imports from Mexico have consistently exceeded U.S. exports by 15 to 20 percent higher during the period. Approximately 44 percent of trade represents exports to Mexico compared to 56 percent coming in to the United States. The study also identified those interior U.S. states (e.g., Michigan, Illinois) that have the most significant surface trade with Mexico.
Products moved by trucks are estimated at an aggregate freight value four to five times higher than products carried by rail, though both modes increased steadily over time (economic downturns notwithstanding). Texas enjoys the most trade with Mexico of any state. Freight activities at Texas POEs (particularly Laredo) are considerably higher than in the other three states combined. In fact, Texas is home to three of the top five POEs (Laredo, Hidalgo, and El Paso). Researchers classified commodities in six groups (roughly: food, minerals, wood, metals, manufactured goods, and “other”). Manufactured goods represented, by far, the commodity shipped most often across the border (both ways).
Project Title
Tracking Freight Traffic Trends at the U.S.-Mexico BorderProject Number
186053-00001
Project Sponsor(s)
Center for International Intelligent Transportation Research
Project Category
Freight Movement
Project Termination Date
This project is ongoing
Project Publications
For More Information
Geza Pesti, Ph.D., P.E.
Associate Research EngineerAdvanced Transportation Operations
Texas A&M Transportation Institute
Texas A&M University System
3135 TAMU
College Station, TX 77843-3135
Ph. (979) 317-2829 Ext. 42829
g-pesti@tamu.edu
Rafael Manuel Aldrete, Ph.D.
Senior Research ScientistResearch and Implementation - San Antonio/El Paso Region – Suite 151
Texas A&M Transportation Institute
Texas A&M University System
4050 Rio Bravo Dr.
El Paso, TX 79902
Ph. (915) 532-3759 Ext. 14101
r-aldrete@tamu.edu