As the old saying goes, you shouldn’t compare apples to oranges. But sometimes evaluating them together can yield interesting information about fruit in general — as long as there’s a valid way to accurately assess the two relative to one another.
Each of Texas’ 254 counties is different from the others, from highways to air quality. To protect the public health, the Federal Clean Air Act requires the Environmental Protection Agency (EPA) to set limits on the amount of certain air pollutants. Air pollution can cause various health threats, from simple throat inflammation to respiratory and cardiovascular disease. Areas that exceed EPA standards are said to be in “nonattainment.” These areas risk losing federal funding if they fail to demonstrate compliance within a given period of time.
The Texas Commission on Environmental Quality (TCEQ) is responsible for ensuring that Texas meets EPA standards, but until now, the agency had no way of reliably tracking air quality trends across the state. To support TCEQ, the Texas Transportation Institute (TTI) has created a first-of-its-kind methodology that allows the direct comparison of Brewster County, in arid West Texas, to Orange County on the mouth of the Sabine River.
“With the tool developed by TTI researchers, TCEQ can identify mobile source air quality trends that are county specific but methodologically consistent,” explains Dennis Perkinson, program manager for TTI’s Transportation Modeling Program. “In short, our model allows the agency to project the potential pollution in a specific county and then compare that county with others statewide.”
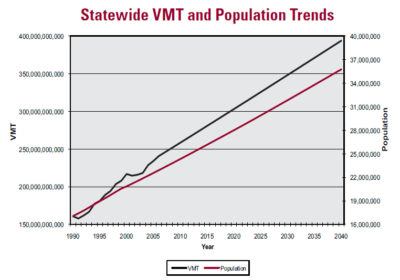
TTI created the methodology to cover all counties, whether they’re currently in nonattainment or not. The model covers 50 years, from 1990 to 2040, to capture data from both the early emissions control programs and the expected effects of new vehicle standards, as well as growth in the number of vehicles on the road. Researchers rely on actual or estimated vehicle miles traveled (VMT) as the primary activity measure for making predictions of on-road mobile source emissions. For future analysis years, VMT becomes a function of historical VMT and the population projections supplied by the Texas State Data Center.
“These analyses of long-term trends support a proactive approach to air quality management that can help preserve the environment and protect public health, from Houston to Wink, Texas,” says Perkinson. “Small towns and big cities — everyone wants clean air.”
The real value of the methodology is that it provides consistent estimates, which means better analysis is possible on a larger scale. And better analysis can lead to smarter policies for the Lone Star State.
“It is our hope that this analysis will make it easier for TCEQ to examine the big picture of air quality throughout Texas,” says Perkinson.
