• Skip to primary navigation
  • Skip to main content
  • Jobs
  • Pressroom
  • MyTTI
  • Contact Us
  • Facebook
  • Twitter
  • LinkedIn
  • YouTube
  • Instagram
  • SlideShare
  • RSS

Texas A&M Transportation Institute

Saving Lives, Time and Resources.

  • About TTI
    • Overview
    • Academic Partners
    • Advisory Council
    • Hall of Honor
    • History
    • Sponsors
    • Participate in Research
  • Focus Areas
    • Connected Transportation
    • Economics
    • Environment
    • Freight
    • Human Interaction
    • Infrastructure
    • Mobility
    • Planning and Operations
    • Policy
    • Safety
    • Security
    • Workforce Development
  • Facilities
    • Connected Transportation
    • Infrastructure
    • Safety
    • Environment
    • Traffic Operations
    • Maps
  • Home
  • Centers
    • National
    • State
    • Research Internships
  • People
    • People Search
    • Directory
  • Publications
    • Catalog Search
    • Texas Transportation Researcher
You are here: Home / News / U.S. DOT’s Texas Transportation by the Numbers Profile

U.S. DOT’s Texas Transportation by the Numbers Profile

March 9, 2015

The US Department of Transportation’s (US DOT’s) Bureau of Transportation Statistics (BTS) has released its State Transportation by the Numbers Profiles 2014 – two-page collections of transportation statistics for each of the 50 states and the District of Columbia.

Highlights from US DOT’s Texas Transportation by the Numbers two-pager point to several efforts recently completed by researchers at TTI’s Transportation Policy Research Center (PRC). These include

  • Vehicle Miles Traveled (VMT) Fees
  • Austin State Agency Congestion Footprint
  • Texas Transportation Poll
  • Oversize/Overweight Vehicle Research Priorities

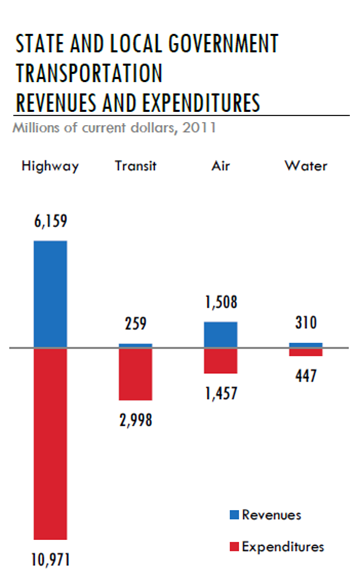
Texas’ transportation network encompasses 30 major airports, 10,469 miles of freight railroad, and 11 border ports of entry. According to the BTS, Texas state and local government highway expenditures exceeded revenues by $4,812 million in 2011. The US DOT’s research found the following:

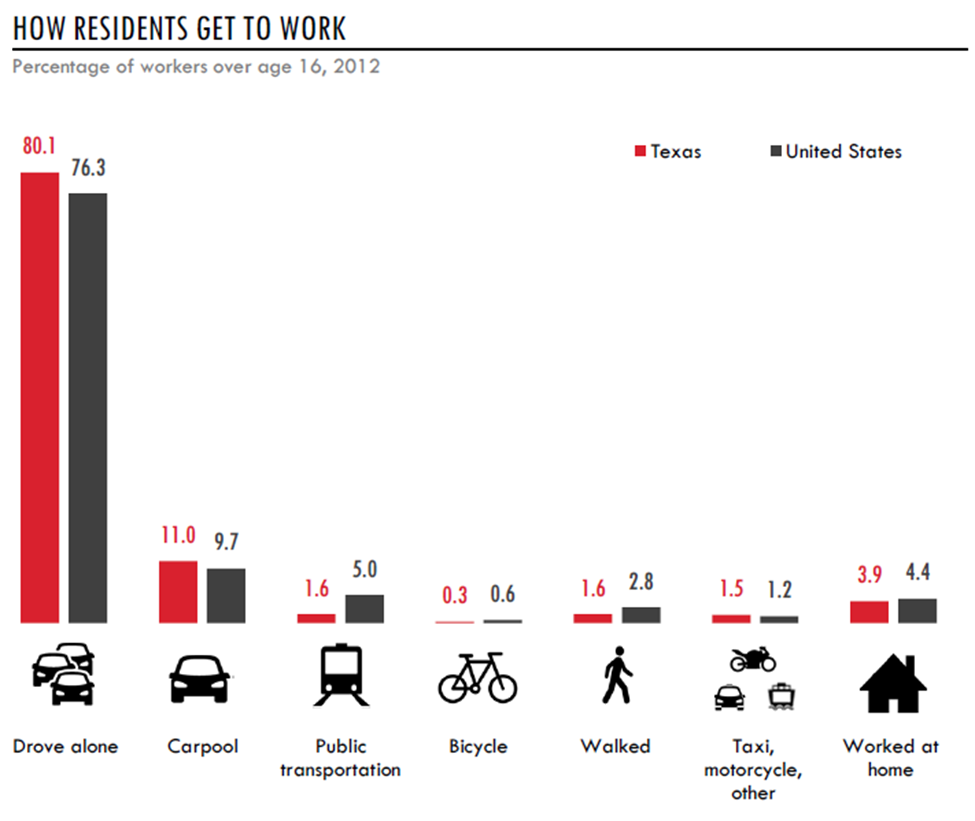
  • 80.1 percent of Texas residents drive alone to work, higher than the national average.
  • Texas ranks second in vehicle miles traveled and first in public road miles.
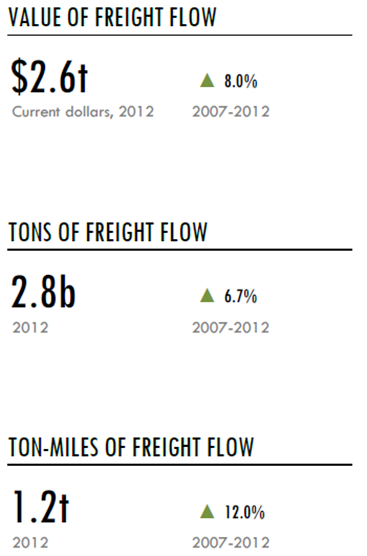
  • The value of freight flow was $2.6 trillion in 2012; up 8 percent starting 2007 through 2012.
  • Texas ranks second in the nation in freight shipments, valuing $1.6 million.
How Residents Get to Work (graphic) -- Percentage of workers over age 16, 2012. | (Texas/U.S.). Drove Alone: 80.1/76.3; Carpool: 11.0/9.7; Public Transportation: 1.6/5.0; Bicycle: 0.3/0.6; Walked: 1.6/2.8; Taxi, Motorcycle, Other: 1.5/1.2; Worked at Home: 3.9/4.4. State and Local Government Transportation Revenues and Expenditures (graphic) -- Millions of current dollars, 2011. | (Revenues/Expenditures). Highway: 6,159/10,971; Transit: 259/2,998; Air: 1,508/1,457; Water: 310/447. (graphic) Value of Freight Flow: $2.6 trillion -- current dollars, 2012. 8% increase for 2007-2012.  Tons of Freight Flow: 2.8 billion -- 2012. 6.7% increase for 2007-2012.  Ton-Miles of Freight Flow: 1.2 trillion -- 2012. 12.0% increase for 2007-2012.

View Texas’ full profile. State-by-state data can also be viewed in the United States Facts and Figures mapping application created by the US DOT’s BTS.

Filed Under: News Tagged With: State transportation by the numbers, Texas transportation, transportation policy research center

  • The State of Texas
  • Texas Homeland Security
  • Texas Veterans Portal
  • State Expenditure Database
  • Statewide Search
  • State Auditor’s Office Hotline
  • TAMUS Risk, Fraud & Misconduct Hotline
  • Site Policies
  • Open Records Policy
  • Statutorily Required Reports
  • TTI Rules
  • Veterans
  • Equal Opportunity
  • COVID-19 Info
  • Jobs
Member of the Texas A&M University System

© 2025 Copyright Statement / Legal Notices and Policies

Comments, suggestions, or queries? Contact us!

Texas A&M Transportation Institute · 3135 TAMU · College Station, Texas 77843-3135

(979) 317-2000