Roadway congestion continues to be a frustration for drivers across the nation. Delays and slowdowns caused by crashes, extreme weather or even road debris dramatically affect the reliability of the transportation system and can add grueling hours to commuter drive times. While congestion may seem unavoidable at times, the ability to track roadway incidents and understand their impacts on congestion levels remains crucial as the transportation system continues to evolve and grow.

freeways.
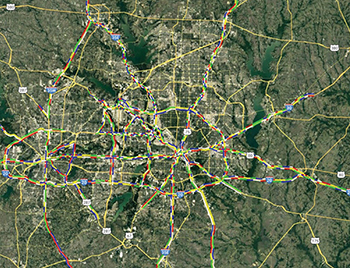
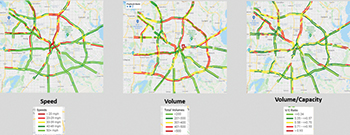
Researchers at the Texas A&M Transportation Institute’s (TTI’s) Dallas urban office have developed an Incident Impact Visualization Tool for the Texas Department of Transportation’s (TxDOT’s) Dallas and Fort Worth traffic management centers (TMCs). Using TxDOT’s intelligent transportation system (ITS) data — among other data sources — the web-based tool is intended to help transportation managers and operators visualize and analyze incidents on the freeway network, such as crashes, lane closures, stalled vehicles and secondary incidents (i.e., an unplanned incident that occurs after the primary incident).
“The tool that we’ve developed for TxDOT allows both Dallas and Fort Worth TMCs to visualize incidents they have not been able to before,” says Minh Le, TTI research engineer. “With over 40,000 freeway incidents reported by TxDOT annually, this tool enables transportation practitioners to go back in time and evaluate an incident based on its impact to traffic flow during a specified date and time range, or incident type.”
The tool fuses ITS sensors and TMC event data with TxDOT’s Crash Records Information System (CRIS) and a third-party weather data source, and displays the output in a playback mode to show operational impacts on the freeway network. Transportation managers, analysts, planners and operators can use the tool to perform post-incident analyses and conduct operational and maintenance planning by assessing roadway network impacts.

A powerful feature of the tool that can assist with these assessments is the estimated delay associated with each incident. Using the incident location and time, the total delay is based on the resulting queue (upstream link speeds relative to historical link speeds) and the duration (playback start and end times). By enabling this feature, end users can:
- conduct a comprehensive analysis of incidents and crashes,
- identify trends/patterns and plan accordingly to help address any future incidents, and
- compare TMC incidents to CRIS crashes.
As the tool continues to be used by practitioners in both the Dallas and Fort Worth TMCs, TTI researchers are regularly identifying ways to improve the tool’s application. Two enhancements were recently added — the ability to search for CRIS contributing factors and multiple CRIS crashes at the same time — with additional enhancements planned for the future.

