TTI’s Advanced Traffic Forecasting Helps Austin Prepare for 2035
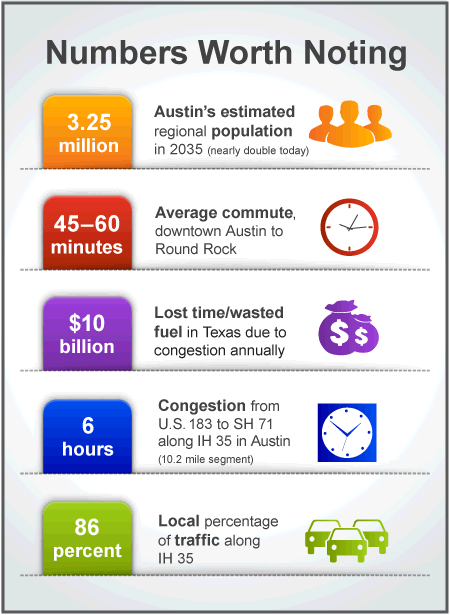
According to the Texas A&M Transportation Institute (TTI), 180,000 vehicles per day drive IH 35 between US 183 and SH 71, the 10-mile central artery for travel and commerce in Austin. Congestion time—defined as the number of hours when travelers cannot travel at least 50 miles per hour on the segment—is estimated at 6 hours on that segment alone. If, as the Capital Area Metropolitan Planning Organization (CAMPO) estimates, the population almost doubles over the next twenty years, how much more congested will Austin’s IH 35 become? Considering that 85 percent of IH 35’s traffic is local, the implications of almost doubling Austin’s population are even more daunting.
 While regional agencies have put forward short- and mid-term congestion mitigation strategies, no long-term ideas have been offered to provide increased roadway capacity. TTI conducted a recent project, Long-Term Central Texas IH 35 Improvement Scenarios, to help capital-area stakeholders identify potential solutions to the mobility problem. They looked at a bigger segment of IH 35, from San Marcos to Georgetown, approximately 70 miles across three counties. The study was funded as part of TTI’s Mobility Investment Priorities Project, and involved the Central Texas Working Group associated with that project. Researchers worked with those agencies and stakeholders to receive guidance and define improvement scenarios.
“We used traffic modeling software that allowed stakeholders to explore alternative strategies,” explains TTI Associate Research Scientist Jeff Shelton. “Modeling lets us cost effectively evaluate all the options so we can focus time and effort on developing the best ideas.”
The team started with the CAMPO regional travel model—a representation of where people live, work, shop, go to school, etc. A dynamic traffic assignment model (DTA)—a relatively new tool in traffic modeling—helped researchers achieve a more accurate representation of projected traffic trends.
“Typically regional travel models rely on broad assumptions of driver behavior such as when they will leave for a trip or what route they will take,” says Shelton. “With DTA, we were able to model more realistic outcomes.”
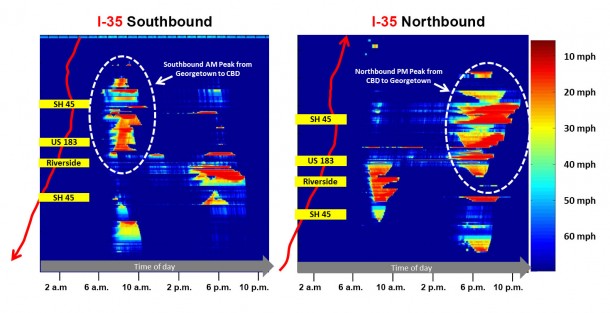
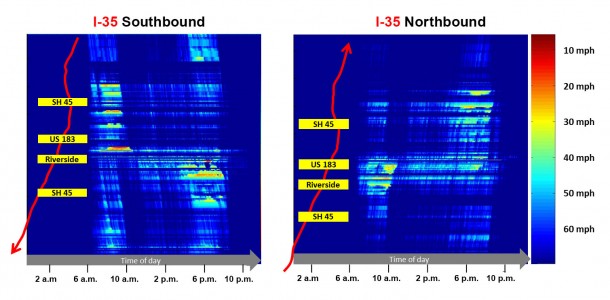
TTI created a visual representation of projected traffic levels in 2035. Akin to a weather map showing thunderstorm intensity, the colors reflect how fast or slow traffic is moving at a given time of day; the bluer, the better. Red means traffic is nearly at a standstill.

“What we found is that peak-period traffic in 2035 is so congested that it spills over into off-peak periods,” explains Shelton. “If we maintain this business-as-usual approach, some folks twenty years from now wouldn’t get home from work until 10 p.m.”
That’s just one example of how travel on IH 35 will become intolerable due to commuter travel delays (up to two hours) and through-trip delays (up to four hours). As a result, researchers say, the local economy and quality of life will suffer since:
- People/business will not move to Austin.
- Trade will move along alternate routes to avoid Austin.
- Central Texans would be forced to change when, where, and how they travel.
The TTI team looked at eight possible improvement scenarios, from following CAMPO’s existing plan (no additional IH 35 capacity) to implementing various managed lane options (including dynamic pricing) to evaluate the impact of potential solutions on area congestion. Researchers only examined traffic performance in the study and did not consider costs or other feasibility issues.
The team also examined two particularly aggressive scenarios. One option to increase capacity would add six lanes (likely tunneled below existing infrastructure) from SH 45 North to SH 45 South with access to and from the new lanes along the way.
Another option would involve drastic change to travel behavior, including:
- Shifting 40 percent of the region’s work commuter trips to work-at-home jobs.
- Reducing university commuter trips by 30 percent region-wide (assuming, for instance, distance learning technology enables students to learn at home).
- Reducing retail shopping trips (perhaps replaced by online options) by 10 percent region-wide.
- Shifting trips to off-peak periods.
- Increasing high-occupancy vehicle, transit, and non-motorized usage by 25 percent each (thereby decreasing single-driver auto vehicle use).
Under the more aggressive approaches, the traffic forecast in 2035 is much brighter. The red areas are essentially gone, though a few remain. These represent localized bottlenecks that local operational strategies could troubleshoot assuming the drastic changes could be accomplished.

As Shelton points out, this evaluation is merely a starting point. But because the results can contribute to the region’s 2040 plan development now underway, the study is a prime example of how research can inform policy discussions and actions. As such, the work will continue through TTI’s Transportation Policy Research Center.
Ultimately, it’s up to local agencies and policymakers to decide which options to pursue, but one thing is clear: doing nothing now will have many Central Texans – as they stumble in from work at 10 p.m. – paying the price later.
“TTI’s long-term analysis is a useful complement to the near-term improvements now being planned,” says Terry McCoy, TxDOT’s deputy district engineer for Austin. “Their modeling effort provides key information that is helping shape the current planning effort.”
For more information, see the Final Report and Executive Summary at http://mobility.tamu.edu/mip/.