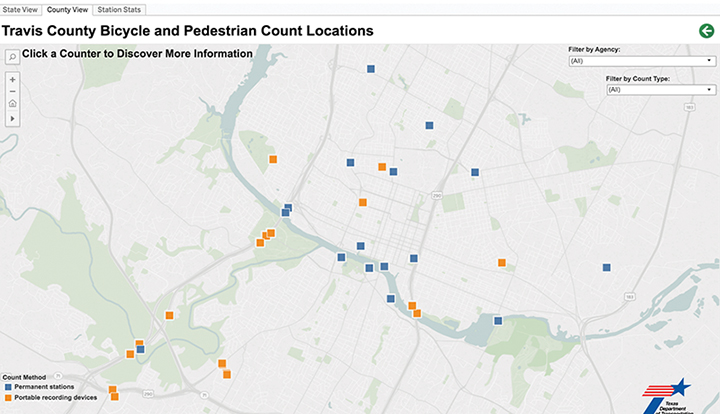
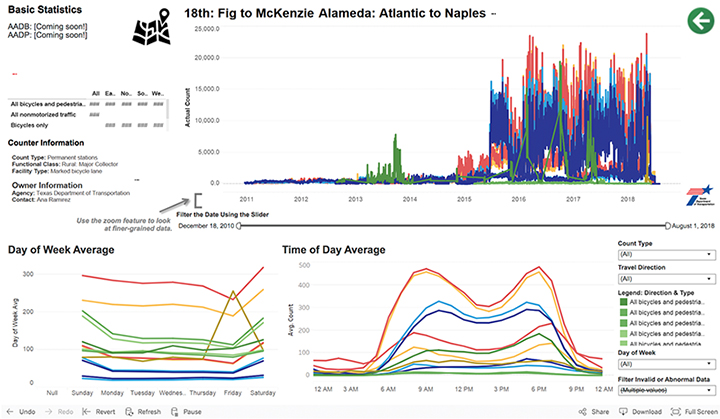
Ever looked at mobility from big picture to small details? Imagine a map of Texas. Select a county. Zoom in to a metropolitan view, checkered with count locations for bicyclists and pedestrians. Clicking on a count location also brings up a screen of charts that display bicycle and pedestrian count data at various time intervals.

Each Texas city often manages its own bicycle and pedestrian monitoring. But coordinating data could help save money and effort spent by public agencies at different levels. The Texas Department of Transportation (TxDOT) asked the Texas A&M Transportation Institute (TTI) to evaluate count equipment and develop a visualization tool to coordinate bicycle and pedestrian count data across the state. The goal is to empower cities and local entities to contribute data to the tool and then use it in future planning.
“Better data can help TxDOT demonstrate active transportation in different districts,” explains TTI Assistant Research Scientist Phil Lasley. Active transportation refers to travel modes that emphasize an active lifestyle — like bicycling or walking — as opposed to driving a vehicle. “The research explored the potential for a collaborative space for local agencies to feed information into a larger system that TxDOT can then leverage to support infrastructure growth. At the local level, each agency is uniquely positioned to identify gaps in its network of counters.”
Because of its limited count data on bicycle and pedestrian patterns, TxDOT would benefit from crowdsourced data providing insights into local patterns. To this end, researchers consulted with TxDOT staff, metropolitan planning organizations, and the Cities of Austin and Houston. Researchers evaluated and installed count equipment in those cities, built a model using crowdsourced data, and created standard categories for how to present those data.

The research team set up a database of bicycle and pedestrian count locations, organized by TxDOT districts and Texas counties, and developed a map-based interface to provide an easy, visual way to sort through the data. The project is ongoing, with more updates planned for the tool, some of which include adding a statistics section and helping agencies to submit, edit and update data. One of the unique aspects of assembling the database was involving local agencies — that are already collecting data — as editors and curators of the information stored.
“Few agencies have similar systems, especially not with editing capabilities built into the system,” notes Lasley. “Agencies will be able to check, flag and factor counts in their local areas. They may know about events in the area that others may not think about. For example, the Austin City Limits music festival is one event that usually brings in a lot of people who are walking or riding bicycles. There might be a larger spike in count data during those weekends.”

Local agencies are on ground zero, from a data perspective. They know the people that live in their city, and they keep track of the trails and parks where people frequently walk and ride bicycles. Because of that, local agencies provide more accurate bicycle and pedestrian count data to TxDOT to use in planning. In turn, TxDOT encourages them to embed the map, developed by TTI, into their websites and share data with colleagues and the public.
“TTI provided the technical expertise that TxDOT needed to centralize count data,” says Bonnie Sherman, TxDOT bicycle and pedestrian program manager. “The map allows users to filter by TxDOT district or state county to see where counts are being collected and see patterns in the city’s active lifestyle. Consolidating count data in a user-friendly platform makes it easier to coordinate efforts across different agencies that are collecting data — this is a partnership, after all.”

