Roadway congestion in Texas, like the weather, is a relative thing. How you define severe depends a lot on where you live.
A sheet of ice on city streets in south Texas might mean it’s a day when schools are closed. The same conditions in the Panhandle mean it’s a winter day ending in Y. And what constitutes a horrific traffic jam is likely very different whether you live in Austin, Abilene or Alice.

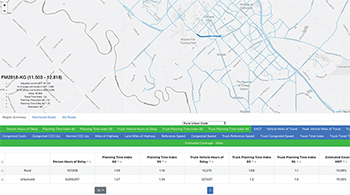
To address this confusion, it helps to have a way to gauge things. And now, transportation professionals can do that with the aid of the Congestion Management Process Analysis Tool (COMPAT), created by Texas A&M Transportation Institute (TTI) researchers and funded by the Texas Department of Transportation (TxDOT).
COMPAT links TxDOT’s statewide roadway inventory database with private-sector speed data — INRIX was selected during the most recent competitive bid — and produces a range of performance measures for individual road segments. Some examples include:
- annual hours of travel delay due to congestion;
- excess fuel consumed due to congestion;
- cost of wasted time and fuel due to congestion;
- travel time index — a ratio illustrating comparison of trip time in congested versus non-congested traffic;
- planning time index — a ratio illustrating extra time needed for on-time arrival for 95 percent of peak trips; and
- additional carbon dioxide produced due to congestion.
Those measures illustrate how well traffic is moving on a particular stretch of roadway on an average day, as well as how much variation occurs from day to day. Transportation professionals can use these metrics to identify, diagnose and treat problem areas through operational changes, travel options, construction or other congestion mitigation strategies.
TTI and TxDOT are providing the tool to all Texas urbanized areas (regions over 50,000 population), giving small and medium-size urbanized area agencies a capability that only major cities enjoyed in the past. This new tool will provide congestion monitoring information required by the federal government for larger urban areas.
“Speed data is much more reliably available now, but local agencies are typically quite busy and frequently understaffed, so they often haven’t been able to dig into the data and put it to good use,” says TTI Senior Research Scientist David Schrank. “COMPAT gives them that capability.”
Applying the data to its highest and best use is essential to making the best possible transportation investment decisions.
In Texas’ case, the current exercise has its roots in 2009, when leaders in the Texas Legislature sought to identify the biggest urban mobility challenges facing the Lone Star State, focusing first on the most severely congested roads. Subsequently, the same leaders launched the Mobility Investment Priorities project, conducted by TTI, to determine where and how the state’s limited resources could produce the greatest return, eventually helping to advance two voter-approved ballot initiatives to support new funding for the most pressing roadway needs.
What started in 2009 as a ranking of about 800 roadway sections in only the biggest urban areas now encompasses 1,854 distinct road segments spread across 66 counties representing all Texas urban areas. The number of sections in a metro region ranges from 19 in San Angelo and Texarkana to 436 in the Dallas-Fort Worth Metroplex. The vastly expanded list is a product of better data and visionary thinking at TxDOT.
Increasing the list of monitored roadways to more than double its original size, Schrank notes, helps to illustrate how congestion is one of those relative things for just about any Texan. “Even smaller cities have congested roadways,” he says. “And they feel the negative effects of gridlock, too.”
COMPAT can help agencies closely monitor conditions on about 105,000 centerline miles of non-local street roadways across the state. COMPAT allows analysis at both regional and corridor levels. A list of multiple road sections can be sorted by a variety of performance variables. Updated annually, the tool can provide for trend analysis over multiple years.
And using the same performance measures regardless of an urban area’s size, agencies can all be speaking a common language.

