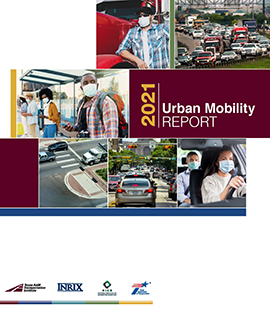
America’s worst public health crisis in a century flattened roadway congestion to levels not seen in 40 years, but the respite was short lived, according to the 2021 Urban Mobility Report (UMR) from the Texas A&M Transportation Institute (TTI).
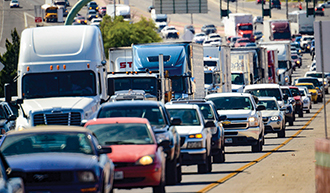
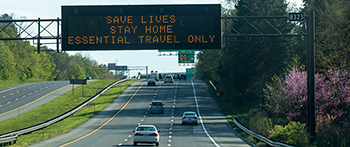
In the pandemic shutdown of spring 2020, daily commuter traffic dropped by almost half compared to the year before. Truck traffic, on the other hand, hardly dropped at all, a result of increased at-home delivery of items as everyday as cereal and toilet paper.
Any traffic snarls that did exist were spread over more hours of the day as rush-hour travelers took on roles as midday shoppers and child transporters. Also, more of each week’s travel delay in 2020 was shifted to the weekend, another result of reduced weekday rush-hour commuting.
As noted by this year’s UMR, Americans experienced four distinct traffic years in one during 2020:
- In January and February, things looked a lot like the year before.
- In March through May, the shutdown produced roadway scenes not seen since George H. W. Bush was president and postage stamps cost a quarter.
- In June through August, rush hours began to reappear, reminding us what traffic was like at the turn of the century.
- In September, delay conditions crept back toward normal, reminiscent of conditions in 2005.
“We’ve been tracking roadway congestion at TTI for almost four decades,” says TTI Senior Research Engineer Bill Eisele. Eisele co-authored the report with TTI Senior Research Scientist David Schrank, Associate Research Engineer Luke Albert and Research Fellow Tim Lomax. “Over that time, we’ve never seen such dramatic drops in traffic delay and associated costs as we did in 2020.”
Although the link between springtime pandemic shutdowns and roadway traffic is apparent, the report notes, some parts of the picture are less clear. For instance, roadway traffic volume and gridlock increased steadily in the fall months even as new COVID-19 cases and hospitalizations were surging.
Regardless of what prompts a sharp and temporary drop in traffic — be it a pandemic or an economic recession — strategies for a more lasting solution remain constant, requiring a balanced and diverse approach. “That includes getting the best possible use out of the current roadway network, adding capacity (whether for cars and trucks or other modes including public transit and bicycle/pedestrian routes), and altering land development patterns,” Schrank says. “Giving travelers more choices about when, where and/or how they travel is also important.
“COVID-19’s impact on traffic was predictable given the shutdowns that occurred,” the authors state in the report. “And the lesson we can draw from our experience is that the simplest path to mitigating roadway gridlock is, and has always been, reducing the demand for limited road space.”
Regional traffic trends during the year contrasted somewhat with those at the national level, according to the study. Even so, every urban area showed considerably more change than has ever been recorded, and 2021 is already seeing the fastest increase in traffic levels since 1982 — the first year of statistics recorded by the UMR.
This year’s study was funded by the Texas Department of Transportation (TxDOT) and the National Institute for Congestion Reduction.
“As the 2021 Urban Mobility Report shows, congestion levels in Texas and much of the rest of the country have rebounded to near pre-pandemic levels,” says Marc Williams, TxDOT executive director. “In Texas, we continue to see the same underlying causes — a growing population and economy that are producing more passenger vehicle and truck traffic on roadways throughout the state. That’s why we’re focused on important initiatives such as Texas Clear Lanes to address the top chokepoints in our state’s largest metropolitan areas, as well as understanding the many facets of the traffic challenges we face. Studies such as the 2021 Urban Mobility Report are an important tool in this effort as we continually work to improve mobility and safety on our roadways.”
