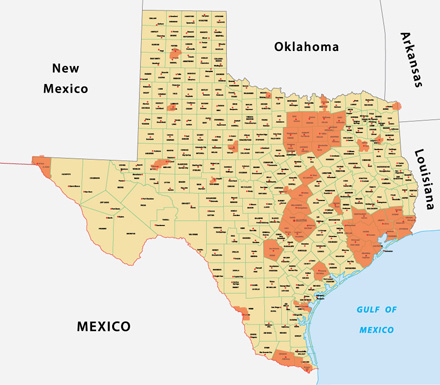
Traffic congestion is relative. What constitutes “bad” depends on where you live. And for the first time, the state’s annual ranking of its most gridlocked roadways will give Texans in smaller cities a look at problem roadways in their own areas, regardless of how they compare to big-city bottlenecks.
What originally began as the list of Texas’ 100 Most Congested Roadways now provides a variety of congestion measures on 1,783 roadway sections spread over 25 urban regions. The analysis is conducted each year for the Texas Department of Transportation (TxDOT) by the Texas A&M Transportation Institute (TTI).
The state’s worsening traffic gridlock is driven largely by a rapid growth in population without a corresponding growth in roadway space. The number of registered vehicles in Texas has nearly tripled — up 172 percent in the past 40 years, while highway space has grown by only 19 percent during the same time. Limited transit use adds to the challenge.
“Transportation continues to be one of the most important drivers we’ve seen in recent years in developing our state’s economic success,” said Jeff Moseley, Texas Transportation Commissioner. “The state’s top 100 most congested roadway list is cause for concern and makes it clear, now more than ever, that we must support Proposition 1 in November in order to grow the funding TxDOT needs to address congestion and safety on these roads in our great state.”
Topping the 2014 list is the IH 610 West Loop in Houston, one step ahead of IH 35 in Austin (last year’s number one). The Southwest Freeway in Houston, US 75 in Dallas, and Stemmons Freeway in Dallas round out the top five.
This year’s study also puts a focus on freight-related congestion. IH 35 in Austin holds the top spot in that category, followed by the Southwest Freeway, Katy Freeway and West Loop in Houston, and Stemmons Freeway in Dallas.
Drivers on the 1,783 congested road sections endure a total of 570 million hours of delay each year, 34 million of which is caused by trucks. Those same trucks account for $2.6 billion of the overall $12.6 billion in total delay costs.
To conduct the analysis, TTI researchers use roadway inventory and traffic volume information from TxDOT along with speed data from INRIX, a private-sector source of traffic data for many traveler information and navigation services.
Planners can use the information to help them examine problem areas, consider possible solutions, and prioritize needs and projects in the face of diminished available roadway funding. The state highway fund depends primarily on vehicle registration fees and the motor fuels tax, which has remained the same at 20 cents per gallon since 1991. Inflation and improved fuel efficiency have eroded its value so that the tax pays for only about half what it did in 1991, according to TTI research.
Those funding challenges, researchers say, make it all the more important to have a clear understanding of urban congestion problems.
“Carefully monitoring our mobility conditions is the first step toward developing solutions — whether we mean system improvements or multimodal solutions,” says TTI Senior Research Engineer Tim Lomax. “Whether for planners or policy makers, it’s really important to have a strong grasp of the problem, because that understanding can lead to more informed decisions.”
Researchers also note that this year’s analysis underscores how congestion is affecting more Texans with each passing year.
“It would be easy to simply dismiss this as a ‘big-city problem,’ says TTI Research Scientist David Schrank. “But doing so would ignore the fact that traffic gridlock in Houston, Dallas-Fort Worth, San Antonio or Austin directly impacts the shipping cost of goods for every small community across the state, and that added freight expense is reflected in what we pay for those goods every day.”
